You have the data. It's sitting in a spreadsheet — orders, revenue, customers, dates. You know what you want to see: a revenue chart, a status breakdown, a table you can actually search. But standing between you and that dashboard is a React project, a charting library, a data layer, and a weekend you don't have.
Here's a faster path.


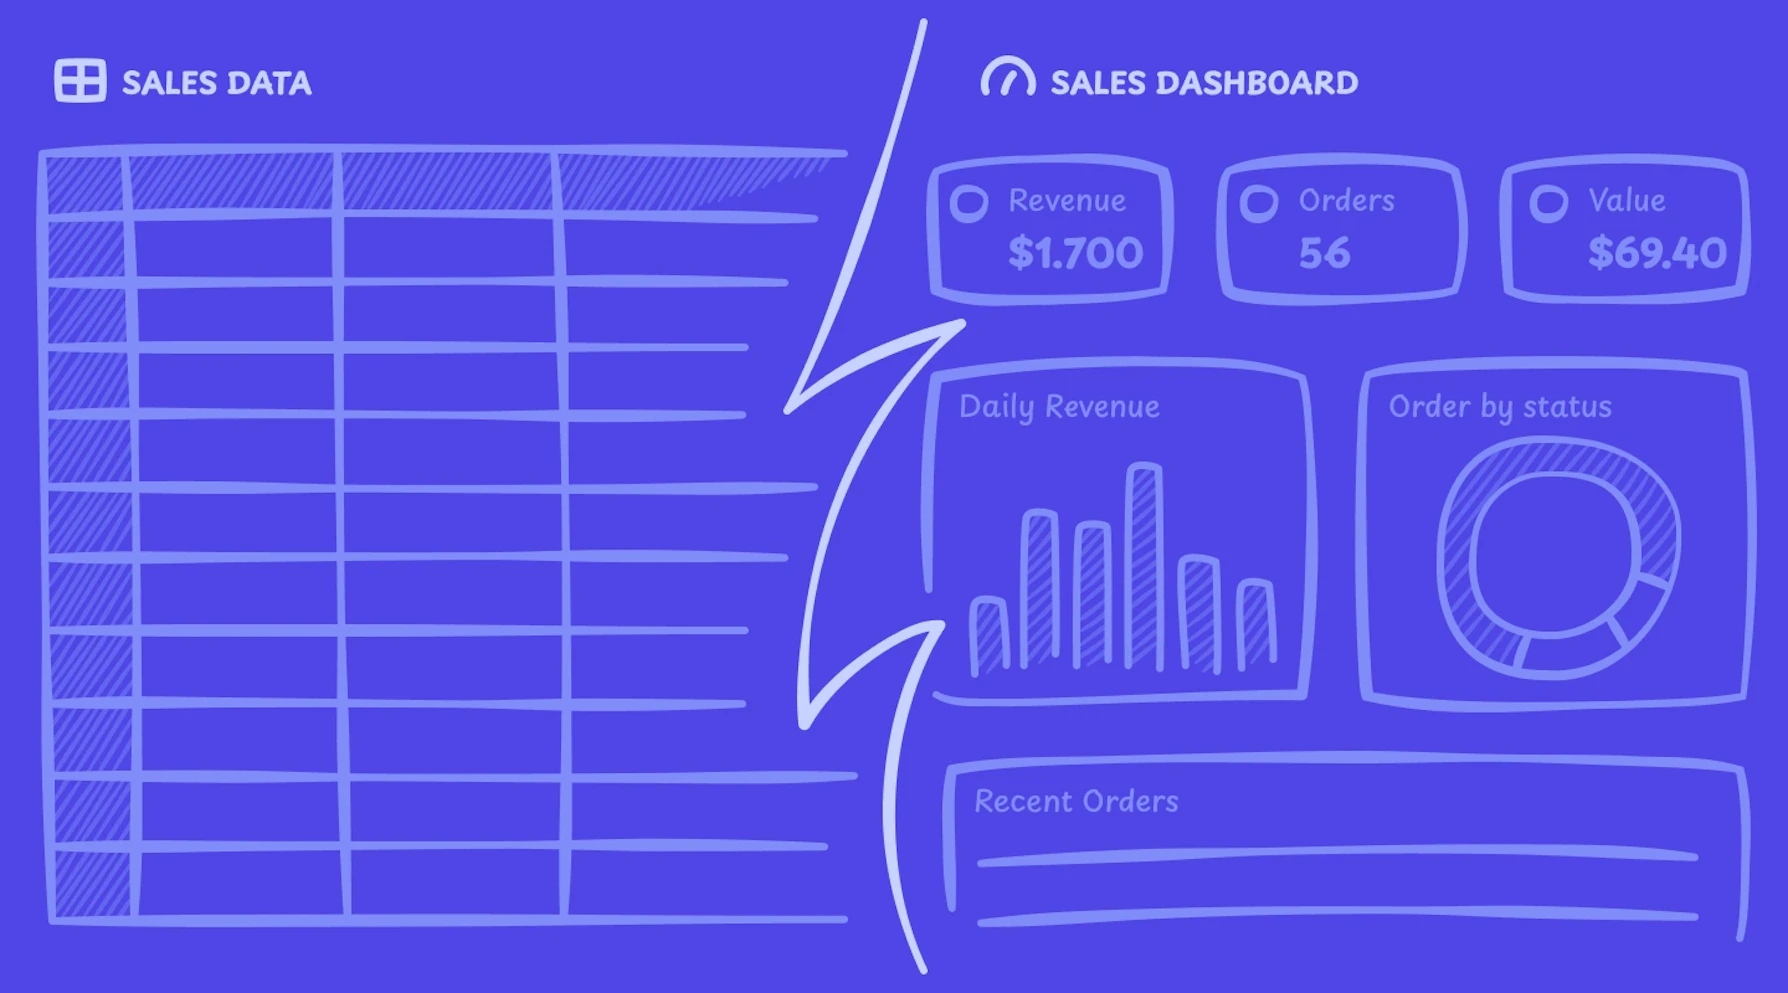
What we're building
A sales dashboard from a plain CSV file. It'll have:
- Total revenue at a glance
- Revenue trend over time
- Orders broken down by status (completed, pending, refunded)
- A searchable, filterable orders table
The whole thing takes a few minutes.
The data
The CSV is straightforward — order IDs, customer names, product tier, amount, status, and date. The kind of export you'd pull from Stripe, Shopify, or a homegrown system.
order_id,customer_name,product,amount,status,date
1001,Sarah Chen,Pro Plan,49.00,completed,2026-02-15
1002,Mike Johnson,Starter Plan,19.00,completed,2026-02-14
Nothing special. That's the point. You don't need to clean it up, normalize the column names, or pre-process anything. You upload it as-is.
One thing worth knowing: if your CSV has a column named date, created_at, timestamp, or anything date-shaped, Refine will automatically use it as the time axis for charts. Same goes for numeric columns like amount or revenue — they're picked up as metric candidates without you having to specify them.
How it works
Upload the file to Refine, then describe what you want in plain text:
"Create a dashboard for this sales data. Show total revenue, a chart of revenue by day, orders by status, and a table of recent orders I can search and filter."
That's the whole prompt. No SQL, no config, no schema definition.
 Refine prompt input with CSV attached
Refine reads the CSV structure, understands the columns, and generates a React app — real components, real data connections, real interactivity. Not a mockup.
The prompt doesn't have to be sales-specific. Any tabular data works the same way. For example:
"Show me monthly churn by product tier over the last 90 days, with a breakdown table I can sort by tier and a trend line."
Or:
"Give me a support ticket dashboard: open vs closed counts, average resolution time, and a filterable table of tickets by assignee."
The more specific you are about what you want to see, the closer the first result lands.
 Refine generating the dashboard from the CSV data
The result
When generation finishes you get a live preview: revenue total at the top, a line chart showing the trend, a status breakdown, and a table with search and filter built in. Click on it, sort it, filter by status — it all works.
 The finished sales dashboard with stat card, chart, and filterable table
If you want to go deeper, you can open the code view. It's standard React. You can edit it, export it, and deploy it wherever you want. No platform lock-in.
 Code view showing the generated React components
Who this is useful for
The obvious case is product and data teams that produce these exports constantly but don't have bandwidth from engineering every time they need a quick visualization. Upload the file, get a dashboard, share a link.
But it's also useful for developers who just want the scaffold fast. Instead of wiring up a charting library and a data table from scratch, you describe the result and edit from there.
What you can connect
Right now Refine supports:
- CSV and Excel file uploads
- Supabase
- Postgres
- REST APIs
Google Sheets integration is coming soon, so you'll be able to point Refine at a live sheet and keep your dashboard in sync automatically without re-uploading.
Try it
If you have a spreadsheet you've been meaning to turn into something useful, this is the fastest way to get there. Upload your CSV at refine.dev and describe what you want to see.
FAQ
Does my data get stored on Refine's servers?
Your CSV is used to generate the app structure. Check the privacy policy for specifics on data handling if you're working with sensitive information.
What if my CSV has different column names?
It doesn't matter. Refine reads the actual column headers from your file and builds around them. You don't need to rename anything beforehand.
Can I connect a live data source instead of a static file?
Yes. Beyond CSV uploads, Refine connects to Supabase, Postgres, and REST APIs today, so you can build dashboards backed by live data. Google Sheets support is coming soon.
Can I edit the generated code?
Yes, and that's the point. The output is standard React — no proprietary abstractions. You can view the code, modify it, export it, and deploy it to any hosting provider.
What kinds of charts and components can it generate?
Line charts, bar charts, stat cards, data tables with search and filter, status breakdowns. Describe what you want in plain text and Refine will pick the right component for the data shape.
Is this only for sales data?
No. The demo uses sales data because it's a common and relatable example, but the same flow works for any tabular data — user activity logs, support tickets, inventory, financial reports, survey results.